Science project
Best Insulators

Grade Level: 3rd - 5th; Type: Physical Science
Objective:
This project will examine which type of insulation holds in the most heat. We will compare the effectiveness of styrofoam coolers, traditional coolers, and insulated bags.
Research Questions:
Which material holds in the most heat for a given time period?
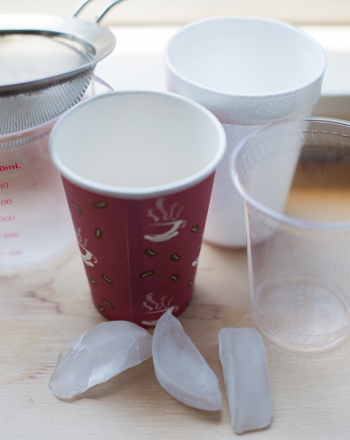
When we produce energy through electricity, the sun, our own bodies, or gas we are producing heat. Heat can be stored in the form of insulation. Insulation prevents heat from escaping an object. Insulated coffee mugs are designed to hold in heat unlike paper cups. You can hold a hot cup of coffee in an insulated mug with your bare hands but if you hold a hot cup of coffee in a paper cup you could potentially burn yourself. Why does this happen? In this experiment we will demonstrate how heat is conserved. By testing different forms of insulation we can determine which material hold in the most heat over time.
Materials:
- Styrofoam cooler
- Cooler
- Insulated bag (Found in the freezer section in grocery stores) *All three containers should be about the same volume.
- 3 empty 1-pint plastic water bottles (All three should be the same)
- Thermometer/temperature probe
Experimental Procedure:
- Heat 6 cups of tap water using a teakettle or microwave to a temperature of around 80°F. Use your thermometer to check the temperature periodically. If using a microwave be sure the container is microwave safe. Do not heat over 80°F because the plastic water bottle may melt.
- Carefully pour 2 cups of hot water into each bottle.
- Take the temperature of each bottle and immediately cap.
- Place a water bottle into the styrofoam cooler, traditional cooler, and insulated bag. Make sure each container is sealed.
- Wait 30 min. Open each container one by one and take the temperature of each bottle and record using the chart below****. Once temperature is recorded immediately cap and place the bottle back into its container.
- Wait another 30 min. and repeat step 5.
- Continue to test every 30 minutes until the water temperature reaches room temperature.
- Chart and graph the change in temperature over time (Figure 1 & 2).
|
Time
|
Styrofoam
|
Cooler
|
Bag
|
|
1:00
|
80
|
80
|
80
|
|
1:30
|
78
|
77
|
76
|
|
2:00
|
75
|
75
|
74
|
|
2:30
|
72
|
74
|
70
|
|
3:00
|
68
|
72
|
68
|
|
3:30
|
66
|
71
|
60
|
|
4:00
|
63
|
68
|
55
|
Figure 1. Chart of temperature changes over time for each insulator.

Figure 2. Graph of temperature changes over time for each insulator.
Terms/Concepts: Thermodynamics; Insulation; Conduction; How do insulators hold in heat?; What types of material hold in heat?
References:
Education.com provides the Science Fair Project Ideas for informational purposes only. Education.com does not make any guarantee or representation regarding the Science Fair Project Ideas and is not responsible or liable for any loss or damage, directly or indirectly, caused by your use of such information. By accessing the Science Fair Project Ideas, you waive and renounce any claims against Education.com that arise thereof. In addition, your access to Education.com's website and Science Fair Project Ideas is covered by Education.com's Privacy Policy and site Terms of Use, which include limitations on Education.com's liability.
Warning is hereby given that not all Project Ideas are appropriate for all individuals or in all circumstances. Implementation of any Science Project Idea should be undertaken only in appropriate settings and with appropriate parental or other supervision. Reading and following the safety precautions of all materials used in a project is the sole responsibility of each individual. For further information, consult your state's handbook of Science Safety.
Related learning resources