Science project
Viscosity, Surface Tension and Temperature

2011 VIRTUAL SCIENCE FAIR ENTRY
Project Title: Do surface tension and viscosity decrease with the increasing temperature? Is there any relation between surface tension and viscosity?
Purpose: The purpose of my project is to prove that as temperature increases, viscosity and surface tension both decrease, and to determine the relationship between viscosity and surface tension with a constant temperature.
Procedure: 1). Surface tension: Put several identical glass cups on the table. Pour 0.2L water in each cup with different temperatures. Put a small piece of identical paper on the water of each cup. Put paper clips on the paper in each cup. Measure the temperature of each cup when the paper clips start to fall down. Repeat the same procedures for vinegar, Coke® and milk. 2). Viscosity: Boil water. Measure 0.2L of water eight times. Put 0.2L of water into 8 identical glass cups. Put six of the glass cups into the refrigerator. Each cup of water will remain in the refrigerator for different periods of time. Put the rest two cups on the counter for different periods of time. Pour the water through the funnel while measuring time using a stop watch for all 0.2L water to pass through the funnel. Repeat the same steps on different liquids: Coke®, milk, and vinegar.
Conclusion: In conclusion, my hypothesis is that as temperature increases, viscosity and surface tension both decrease. Since viscosity and surface tension are both properties of liquids, there is a relationship between them that surface tension varies directly as viscosity at a constant temperature. My hypothesis is correct. However, there are experimental errors and statistical errors in the project.
Type: Chemistry
Grade: 12th Grade
Difficulty of the Project: Medium
Cost: $15
Safety Issues: There are no hazardous substances in this project.
Time Taken to Complete the Project: 3 months
Objective
The purpose of my science fair project is to prove that as temperature increases, viscosity and surface tension both decrease, and to determine the relationship between viscosity and surface tension with a constant temperature.
Materials
- Thermometer
- paper clips
- small pieces of paper
- kitchen stove
- glass drinking cups
- measuring cup
- digital balance
- 2% milk
- vinegar
- Coke®
- Tap water
- funnel
Introduction
A small insect resting on the surface of a pond or a lake is a common sight in the summertime. The insect creates tiny dimples in the water’s surface, almost as if it were support by a thin sheet of rubber. In fact, the surface of water and other fluids behaves in many respects as if were an elastic membrane. This effect is known as surface tension (Moore, 1962) The reason forming the surface tension, according to the theory of Brown et al, is that, “A molecule deep within a fluid exerts attractive forces in all direction, due to the molecules that surround it on all sides. The net force on such a molecule is zero. As a molecule nears the surface, however, it experiences a net force away from the surface, since there are no fluid molecules on the other side of the surface to attract it in that direction. It follows that work must be done on molecule to move it from within a fluid to the surface, and that the energy of a fluid is increased for every molecule on its surface.” (Brown, Lemay, &Bursten, 2006) From an energy standpoint, in order to extend the area of an interface to bring molecules from the interior into the surface, work must be done against the cohesive force in the liquid. The strength of surface tension depends on intermolecular forces. As temperature increases, molecules of liquid become more active and they move more rapidly; therefore, the intermolecular forces are more instable. Surface tension decreases with increasing temperature.
Afluid flowing past a stationary surface experiences a force opposing a flow. This tendency to resist flow is referred to as the viscosity of a fluid. Fluids like air have low viscosities, thicker fluids like water are more viscous, and fluids like honey and motor oil are characterized by high viscosity. Viscosity describes a fluid’s internal resistance to flow and may be thought of a measure of fluid friction. The greater a liquid’s viscosity, the more slowly it flows. Viscosity can be measured by timing how long it takes a certain amount of the liquid to flow through a thin tube under gravitational force. More viscous liquids take longer. Viscosity can also be determined by measuring the rate at which steel spheres fall through the liquid. The spheres fall more slowly as the viscosity increases. Viscosity is related to the ease with which individual molecules of the liquid can move with respect to one another. It thus depends on the attractive forces between molecules and on whether structural features exist that cause the molecules to become entangled. As temperature increases, the average kinetic energy of the molecules is greater; it is more easily overcomes the attractive forces between molecules. Therefore, viscosity decreases with increasing temperature (Physics Hypertextbook, n. d.).
Term and Concepts for Background Research
- Surface tension is a property of the surface of a liquid that allows it to resist an external force.
- Viscosity is a measure of the resistance of a fluid which is being deformed by either shear stress or tensile stress.
- Dipole-dipole forces are attractive forces between the positive end of one polar molecule and the negative end of another polar molecule.
- An ion-dipole force is an attractive force that results from the electrostatic attraction between an ion and a neutral molecule that has a dipole.
- Colloid is a system in which finely divided particles, which are approximately 10 to 10,000 angstroms in size, are dispersed within a continuous medium in a manner that prevents them from being filtered easily or settled rapidly.
- Saturated fat is fat that consists of triglycerides containing only saturated fatty acids; therefore, saturated fat is polar molecule.
- Proteins are biochemical compounds consisting of one or more polypeptides typically folded into a globular or fibrous form in a biologically functional way. Proteins will denaturize at high temperature.
- Hydrogen bond is the attractive interaction of a hydrogen atom with an electronegative atom, such as N, F or O.
Hypothesis
My hypothesis, for my science fair project, is that as temperature increases, viscosity and surface tension both decrease. Since viscosity and surface tension are both properties of liquid, there is a relationship between them that surface tension varies directly as viscosity with temperature being constant.
Methods of Procedure
Viscosity
- Boil water in the electrical kettle. Measure 0.2L of water in the measuring cup eight times. Put 0.2L of water into 8 identical glass cups.
- Put six of the glass cups into the refrigerator in order to cool them down. Each cup of water will remain in the refrigerator for different periods of time. The reason for this is that each cup needs a different core temperature.
- Put one cup on the counter, and use the other one to do Step 4 so as to have different high temperatures.
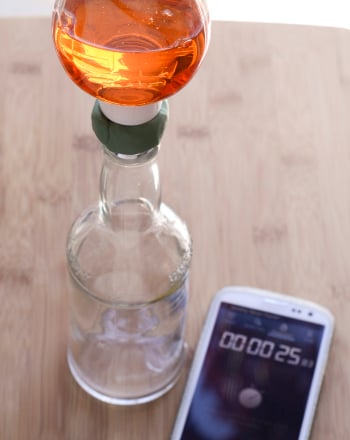
- Pour the water through the funnel while measuring time using a stop watch for all 0.2L water to pass through the funnel.
- Repeat Step 4 with the six glass cups in the refrigerator and one cup on the counter to get flowing times at different temperatures.
- Repeat Step 1-Step 5 on different liquids: Coke®, milk, and vinegar.
Surface Tension
- Put several identical glass cups on the table; chill water in a large container in the freezer, and boil water on the stove.
- Combine the chilled water and boiling water in each cup to achieve different compositions of chilled water and boiling water and stir the water in order to get different temperatures.
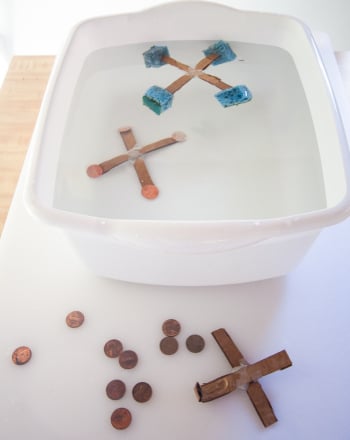
- Put a small piece of identical paper on the surface of the water of each cup for better pressure distribution.
- Put paper clips on the paper in each cup until the paper clips begin to fall; measure the temperature of each cup when the paper clips start to fall down.
- Repeat the same procedures for vinegar, Coke® and milk.
Results
1. Water
|
Temperature (℃) |
Mass of Paper Clips staying on 0.2L water above the paper(g) |
Temperature (℃) |
Mass of Paper Clips staying on 0.2L water above the paper(g) |
|
7.41
|
9.81
|
52.9
|
3.06
|
|
12.1
|
8.50
|
57.2
|
2.72
|
|
14.7
|
7.82
|
66.0
|
2.04
|
|
16.9
|
7.14
|
74.2
|
1.70
|
|
26.2
|
5.10
|
82.3
|
1.70
|
|
27.4
|
5.10
|
85.1
|
1.36
|
|
34.2
|
3.40
|
87.7
|
1.36
|
|
51.1
|
2.38
|
92.5
|
1.02
|

|
Temperature(℃)
|
Time of flowing 0.2L water through the funnel
|
Temperature(℃)
|
Time of flowing 0.2L water through the funnel
|
|
2.5
|
9.9 sec
|
45.5
|
7.4 sec
|
|
13
|
8.9 sec
|
57
|
7.2 sec
|
|
15.5
|
8.4 sec
|
80
|
6.7 sec
|
|
36.5
|
7.9 sec
|
91
|
6.2 sec
|
|
40
|
7.5 sec
|
97
|
5.9 sec
|

Using the equation of water surface tension from Page 6 to substitute in the equation of water viscosity, we arrive at this equation:
Viscosity=0.2995(Surface Tension-16.966) +11.251
2. Coke®
Coke® Surface Tension
|
Temperature (℃) |
Mass of Paper Clips staying on 0.2L coke above the paper(g) |
Temperature (℃) |
Mass of Paper Clips staying on 0.2L coke above the paper(g) |
|
1.92
|
11.9
|
40.4
|
4.08
|
|
4.82
|
9.86
|
53.8
|
4.08
|
|
10.7
|
9.18
|
67.2
|
2.72
|
|
23.8
|
5.44
|
87.4
|
2.04
|
|
37.7
|
3.74
|
90.5
|
1.36
|

|
Temperature(℃)
|
Time of flowing 0.2L coke through the funnel
|
Temperature(℃)
|
Time of flowing 0.2L coke through the funnel
|
|
2
|
9.5sec
|
50
|
7.9 sec
|
|
16
|
8.7 sec
|
52
|
7.7 sec
|
|
29
|
8.1 sec
|
70
|
7.5 sec
|
|
37
|
7.9 sec
|
102
|
7.1 sec
|

Using the equation of Coke® surface tension from Page 8 to substitute in the equation of Coke ® viscosity, we arrive at this equation:
3. Vinegar
Vinegar Surface Tension
|
Temperature (℃)
|
Mass of Paper Clips staying on 0.2L vinegar above the paper(g)
|
Temperature (℃)
|
Mass of Paper Clips staying on 0.2L vinegar above the paper(g)
|
|
1.06
|
12.24
|
34.3
|
4.08
|
|
3.78
|
9.86
|
42.1
|
3.06
|
|
8.57
|
7.82
|
56.8
|
2.04
|
|
19.1
|
5.1
|
63.3
|
1.7
|
|
23.6
|
5.1
|
81.5
|
1.02
|

|
Temperature(℃)
|
Time of flowing 0.2L vinegar through the funnel
|
Temperature(℃)
|
Time of flowing 0.2L vinegar through the funnel
|
|
4
|
10.3sec
|
58
|
7.9sec
|
|
16
|
9.1sec
|
74
|
7.3sec
|
|
31
|
8.4sec
|
87
|
6.9sec
|
|
35
|
8.2sec
|
103
|
6.5sec
|

Using the equation of vinegar surface tension from Page 10 to substitute in the equation of vinegar viscosity, we arrive at this equation:
Viscosity=0.3551(Surface Tenson-13.031) +11.377
4. Milk
Milk Surface Tension
|
Temperature (℃) |
Mass of Paper Clips staying on 0.2L milk above the paper(g) |
Temperature (℃) |
Mass of Paper Clips staying on 0.2L milk above the paper(g) |
|
0.53
|
13.26
|
39.7
|
4.42
|
|
5.37
|
9.52
|
47.1
|
3.06
|
|
9.54
|
8.16
|
67.4
|
2.72
|
|
16.8
|
6.46
|
85.1
|
3.06
|
|
20.5
|
6.12
|
92.7
|
2.04
|

|
Temperature(℃)
|
Time of flowing 0.2L milk through the funnel
|
Temperature(℃)
|
Time of flowing 0.2L milk through the funnel
|
|
2
|
9.7sec
|
54.5
|
8.1sec
|
|
7
|
9.2sec
|
64
|
7.7sec
|
|
17
|
8.9sec
|
89
|
7.4sec
|
|
30
|
8.5sec
|
102
|
7.1sec
|

Using the equation of milk surface tension from Page 12 to substitute in the equation of milk viscosity, we arrive at this equation:

This graph summarizes all the previous relationships between Surface Tension and Temperature for all liquids.

This graph summarizes all the previous relationships between Viscosity and Temperature for all liquids.

*I simply left the unit of Surface tension as grams as it was measured in the experiments.
This graph summarizes all the previous relationship between Surface Tension and Viscosityfor all liquids.
Equations
Surface Tension
Water surface tension= -3.547ln (T) +16.966
Coke surface tension= -2.737ln (T) +14.271
Vinegar surface tension= -2.653ln (T) +13.031
Milk surface tension= -2.237ln (T) +12.561
Water viscosity= -1.1048ln (T) +11.251
Coke viscosity= -0.594ln (T) +10.067
Vinegar viscosity= -0.942ln (T) +11.377
Milk viscosity= -0.637ln (T) +10.407
From 0°C to 100°C Y: viscosity X: surface tension
|
Analysis
(Following is a detailed analysis of the significance of what each graph shows.)
According to the graphs, surface tension and viscosity both decrease as the temperature increases. Because as the temperature increases, liquid particles move more rapidly, the particles gain energy from heat by rising temperatures and convert heat into kinetic energy. Also, because of the input of external energy, chemical bonds in liquids are broken; therefore, it is easier for liquid particles to move.
When I look at the graph summarizing the relationship between Temperature and Surface Tension for all liquids, I find out that water supports the most mass, then coke supports the second most mass, then milk supports the third most mass, and vinegar supports the least mass at lower temperatures. Because of strong hydrogen bonds, water supports the most mass. Coke is mostly made up of carbonated water, sugar, caffeine, phosphoric acid, caramel, and natural flavorings. Therefore, there are dipole-dipole forces that are an attractive force between the positive end of one polar molecule and the negative end of another polar molecule and ion- dipole forces that are an attractive force that results from the electrostatic attraction between an ion and a neutral molecule that has a dipole. However, because the solubility of CO2 decreases with the increasing temperature, Coke® would have a stronger dipole-dipole force at lower temperatures than that at higher temperatures. Milk contains significant amounts of saturated fats and proteins. Because fat is polar molecule, there are dipole-dipole forces in milk. Also, milk is a colloid which contains big particles. Therefore, milk supports the third most mass. Vinegar only has dipole-dipole forces and London dispersion forces; therefore, it supports the least mass. But at higher temperatures, milk supports the most mass, Coke® supports the second most mass, then vinegar supports the third most mass, and water supports the least mass. Milk forms a membrane on the surface at higher temperatures, because milk contains proteins, and the proteins would denaturize with the increasing temperature. This is the reason that milk supports the most mass at higher temperatures. Even though, particles in the vinegar move more rapidly with increasing temperature, there are still dipole-dipole forces in the vinegar. However, most of the hydrogen bonds in the water are broken at higher temperatures; therefore, water supports the least mass at higher temperatures.
Milk is a colloid which means molecules in the milk are big particles. Therefore, the viscosity is big. According to the graph summarizing the relationship between Temperature and Viscosity for all liquids, the curve of milk is the least steep. It reveals that the viscosity of milk does not change a lot with increasing temperatures because of its nature—colloid. As the temperature increases, the water molecules move more rapidly; therefore, the hydrogen bonds are being broken. As is shown on the graph, water has a high viscosity at lower temperatures but low viscosity at higher temperatures, because particles gain energy form heat by rising temperatures and become more active. Even though the dipole-dipole forces of vinegar decrease with increasing temperatures, the curve of vinegar is less steep than the curve of water, because the density of vinegar is larger than that of water. The density of vinegar is 1.04 g/cm3, and the density of water is 1 g/cm3.
When I look at the summary graphs, Coke® acts more differently from the other three liquids because of the CO2. The solubility of CO2 decreases with the increasing temperature. At lower temperatures, CO2 dissolves in the water and reacts with the water to form H2CO3 (Carbonic acid); however, the amount of H2CO3 formed is slight. Most of the CO2 dissolves in the water instead of reacting with the water. The dissolved CO2 is attached to H2O by hydrogen bonds. It explains the reason that Coke® supports the second most mass at lower temperatures. At higher temperatures, Coke® still supports the second most mass. Because even though CO2 comes out of solution from Coke® with increasing temperature, there are still dipole-dipole forces and ion-dipole forces. Because there are not many hydrogen bonds created by CO2 and H2O in Coke®, the effect of the disappearance of hydrogen bonds is not significant. The reason Coke® acts differently from the other three liquids is due to the complexity of coke and the presence CO2.
By graphing the relationship between Temperature and Surface Tension and the relationship between Temperature and Viscosity, I obtain the best-fit trend line that shows each liquid’s mathematical relationship between Temperature and Surface tension and Temperature and Flowing time, and then I use the best-fit trend line equations to calculate the equations of each liquid’s surface tension and viscosity. As the surface tension increases, the viscosity increases, because at higher temperatures the surface tension is low, and also, at higher temperatures the viscosity is low. It is based on the concept that particles in liquid gain energy from heat by rising temperatures and convert the energy into kinetic energy. Since the particles have more kinetic energy, they move more rapidly, which weakens the intermolecular force attractions in liquids.
Conclusion
In conclusion, the purpose of my science fair project is to prove that as temperature increases, viscosity and surface tension both decrease, and to determine the relationship between viscosity and surface tension at a constant temperature. My hypothesis, for my science fair project, is that as temperature increases, viscosity and surface tension both decrease. Since viscosity and surface tension are both properties of liquids, there is a relationship between them that surface tension varies directly as viscosity at a constant temperature. My hypothesis was shown to be correct.
However, there are experimental errors and statistical errors in the project. Temperatures I measured are not accurate because the heat transfers to the surroundings; however, I cannot keep the temperature constant because of the limitation of equipments. Also, there are other small experimental errors, such as the measuring time and slight amount of liquid that attaches to the walls of glass cups and of the funnel. I calculate the equations of Surface tension vs. Viscosity for Coke®, water, milk, and vinegar based on the best-fit trend line that I find on the Excel; therefore, there are statistical errors in the equations. However, because of my limited knowledge on the statistics, I do not know how to calculate the statistical errors. If I can find the uncertainty, I will get more accurate and clearer relationship of each liquid’s Surface Tension vs. Viscosity curve. I infer that the sequence of the curves of each liquid’s Surface Tension vs. Viscosity may depend on the densities of each liquid.
If I were to do the project again, in my opinion, it would not change. The data might be slightly different because of experimental and statistical errors. I think the linear relationship between Surface Tension and Viscosity for all four liquids can be verified by doing the project again.
I would like to research the relationship between surface area and surface tension. Also, I want to expand my research to study the relationship between density, viscosity and surface tension at a constant temperature. Then, I would like to construct a general mathematic equation for these three liquid properties for every liquid for a given temperature. As a result, knowing two of these three liquid properties, we can find out the other property, and we can figure out what the temperature is at that time.
References
Brown, T.L., Lemay, H. E., Jr., & Bursten, B. E. (2006). Chemistry: The central Science. Upper Saddle River, NJ: Pearson Education, Inc.
Khemani, H. (n.d.). Effect of Temperature on the viscosity of the fluid. Retrieved Nov 12th, 2010, from http://www.brighthub.com/engineering/mechanical/articles/10873.aspx
Moore, W. J. (1962). Physical Chemistry. Englewood Cliffs, NJ: Prentice-Hall, Inc.
Ophardt, C.E. (n. d.). Hydrogen bonding. Retrieved Nov 12th, 2010, from http://www.elmhurst.edu/~chm/vchembook/ 161Ahydrogenbond.html
Packard, K. A., Jacobs, D. H., & Marshall, R. H. (2007). Chemistry. Shoreview, Minnesota: Pearson AGS Globe.
Physics Hypertextbook. (n. d.) Viscosity. Retrieved Nov 12th, 2010, from http://physics.info/viscosity/
Schlumberger Excellence in Educational Development. (n. d.) Viscosity of liquids. Retrieved Nov 12th, 2010, from http://www.seed.slb.com/labcontent.aspx?id=9488
Walker, J. S. (2007). Physics. Upper Saddle River, NJ: Pearson Education, Inc.
Xu, Z. W. (n. d.). Surface Tension. Retrieved Nov 12th, 2010, from http://360edu.com/zhuanti/gao2/wu/59.html
Education.com provides the Science Fair Project Ideas for informational purposes only. Education.com does not make any guarantee or representation regarding the Science Fair Project Ideas and is not responsible or liable for any loss or damage, directly or indirectly, caused by your use of such information. By accessing the Science Fair Project Ideas, you waive and renounce any claims against Education.com that arise thereof. In addition, your access to Education.com's website and Science Fair Project Ideas is covered by Education.com's Privacy Policy and site Terms of Use, which include limitations on Education.com's liability.
Warning is hereby given that not all Project Ideas are appropriate for all individuals or in all circumstances. Implementation of any Science Project Idea should be undertaken only in appropriate settings and with appropriate parental or other supervision. Reading and following the safety precautions of all materials used in a project is the sole responsibility of each individual. For further information, consult your state's handbook of Science Safety.
Related learning resources